
MARKET OVERVIEW
The commercial property market has entered a stabilization period, although the degree of stabilization has varied across industry classes and geographical locations.
There is no ‘broad-brush view’ of the current commercial property market. Rate changes and amendments of terms and conditions have been uneven across the excess and surplus lines (E&S) segment of the industry. Disciplined underwriting, restructured reinsurance arrangements and more comprehensive underwriting data have impacted the marketplace, as has the slight increase in capital cautiously entering the property arena.
As we move through 2024, RT Property is paying particularly close attention to extreme weather patterns, economic concerns, supply chain disruption, AI (artificial intelligence) developments, reinsurance challenges and social inflation.
The excess & surplus lines arena continues to grow its market share with AM Best reporting in September 2023 total surplus lines premium for 2022 at $98.5 billion, which represented a 19% increase over 2021. The latest surplus lines premium represents a 216% increase since 2011. In November 2023, AM Best has revised its E&S carriers outlook from stable to positive, “citing increased business due to declining capacity in commercial lines and some personal lines markets, along with strong underwriting results driving favorable operation profitability and strengthened capital positions.”
The fifteen largest states with surplus lines stamping offices, which represent approximately 74% of total surplus lines premium, collaborated to track their data by coverage line. This combined data shows a 31.8% growth of property premium through year end 2023. The fifteen largest stamping offices also noted a 5.2% increase in the number of surplus lines policies.
In the Wholesale & Specialty Insurance Association (WSIA)’s 2023 Surplus Lines Stamping Office Annual Report, Janet Pane, Executive Director at the Excess Lines Association of New York cited property insurance being one of the product lines driving the increase. Pane also went on to emphasize the importance of the E&S market “addressing societal, climate, geopolitical and technological changes.” She added that, “These transformations create a protection gap for consumers, presenting the insurance industry with an opportunity for reinvention, with the E&S market at the forefront of innovation.”
Along the lines of innovation, Lloyd’s is currently in the process of transitioning all market participants from a 30-plus-year-old mainframe system to a cloud-based platform. While the next phase has been pushed back to April 2025 to allow their market participants more time to prepare, it represents a global push across the industry for the standardization of data so communication can be more easily made across platforms, especially with AI becoming more prominent.
The demand for additional and accurate data increased over the past few years to enable insurers and reinsurers to better understand and underwrite risks and estimate losses. Even though the market may be in a stabilization period, the need for complete data will not diminish.
REINSURANCE
Overall, the property reinsurance market remains favorable with overall rate changes continues to be stable across the sector. Rates have risen over the past few years, and loss costs have kept pace. In particular, the “property per risk” market has been impacted quite negatively by secondary peril events such as increased severe convective storm activity on top of a continuing, although not as severe, inflationary environment.
Other January reinsurance renewals experienced more stability in terms of pricing and overall terms and conditions. Compared to January 2023, reinsurance rate increases were not as steep given the effect of changes to terms and conditions and the strong compounding rate changes on the original primary business through the past few renewal cycles. For the most part, the market appears to have a more aligned consensus of where rates and terms should settle. While there are still instances of nonconcurrency, there are fewer instances of this dynamic than in January 2023.
Primary reinsurance companies took larger net retentions on their per risk “excess of loss” (XOL) programs partially as a result of reinsurers requiring cedants to carry minimum retentions based on client surplus size with rates as expected or slightly higher. Reinsurers have more confidence that primary companies have instituted the necessary valuation changes to reflect actual exposure, though some pockets of this valuation gap remain. Adequate and accurate insured data remains key!
In general, the market saw no easing of contract terms and conditions at the January 1, 2024 reinsurance renewal period. However, there were some instances where cedents received improved ceding commissions on their proportional reinsurance purchases. These were limited to those clients who attained higher than expected rate changes and where the expected profit margins were particularly strong and went beyond what was priced within their expiring treaty. In addition, a few companies opted to cede less proportional reinsurance in 2024 versus 2023. See Figure 1 for the Howden pricing index for primary, reinsurance and retrocession
markets for 2012 - 2024.
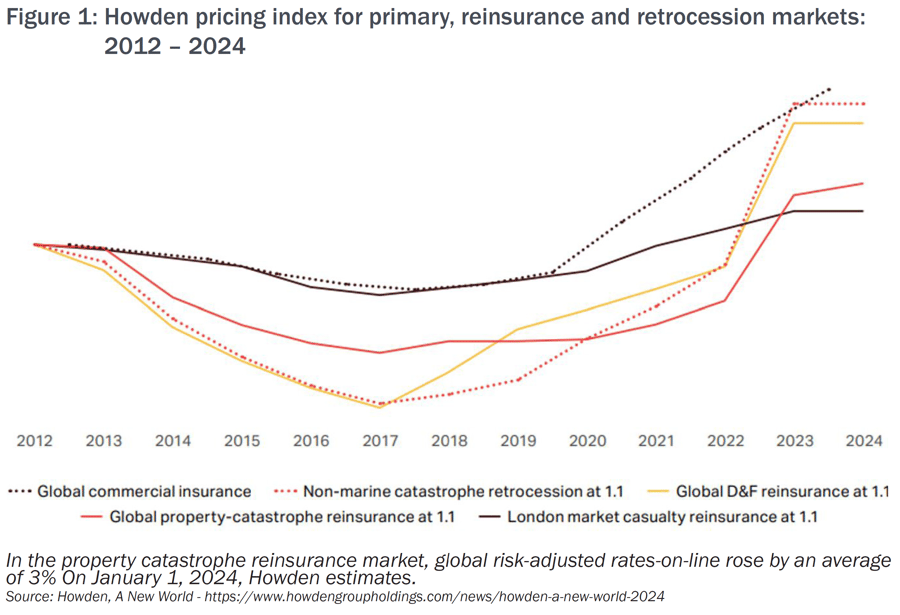
“In a marked change on a year ago, the supply of property catastrophe reinsurance capacity at the January 1 renewal was more than adequate to meet demand, resulting in a competitive environment for peak perils and upper layers,” according to Aon in a market report titled “Reinsurance Market Dynamics - January 2024."
SEVERE CONVECTIVE STORM
Insured losses from secondary perils continue to increase year over year with severe convective storm (SCS) being the biggest driver of these losses. According to a report from Swiss Re, over 50% of the global secondary peril losses have come from severe convective storms. Of these losses, about 50-80% are the result of hailstorms. This past year continued the upward trend making 2023 the worst year on record, for secondary peril losses, exceeding $50 billion in insured losses. Primary property insurance carriers bore the brunt of these claims. Seven out of ten of the costliest storms of 2023 were U.S. SCS events.
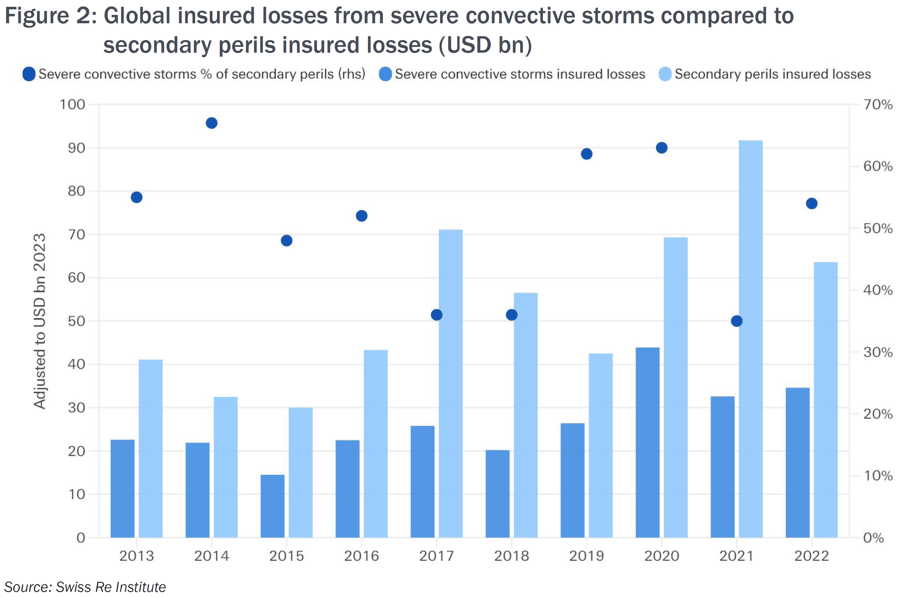
To mitigate their losses, carriers have restricted terms in recent years for the SCS peril in the form of increased deductibles and more restrictive sublimits. The lack of historical data and granular exposure data present a challenge to underwriters when analyzing this peril.
While it may seem practical that climate change is the cause of the higher level of losses, research shows that exposure changes are the primary drivers of SCS losses. A single SCS event may rarely result in a large economic loss, yet the cumulative effect of frequent, low-loss events may have a bigger impact on an insurer’s profitability.
Though severe convective storm events such as tornadoes, hailstorms and thunderstorms are typically short lived, they can hit suddenly and with a great deal of intensity. In terms of frequency of events, 2023 was not an outlier year, though the number of occurrences was above average.
The higher dollar amount of insured losses can be attributed, in part, to these events striking densely populated areas, increasing property values and repair costs. Broad shifts in the economy and land uses also contributes to the evolving SCS risk. Because of these factors, proper risk management and underwriting are critical.
BUILDER’S RISK
Builder’s risk accounts with catastrophe (CAT) exposures, large wood frame projects ($100M+) and renovations continue to be a challenge in the marketplace with many needing participation from the excess & surplus lines segment. In 2023, E&S carriers along with MGU / MGAs were able to meet the demand and bring much needed additional capital to the structure placements.
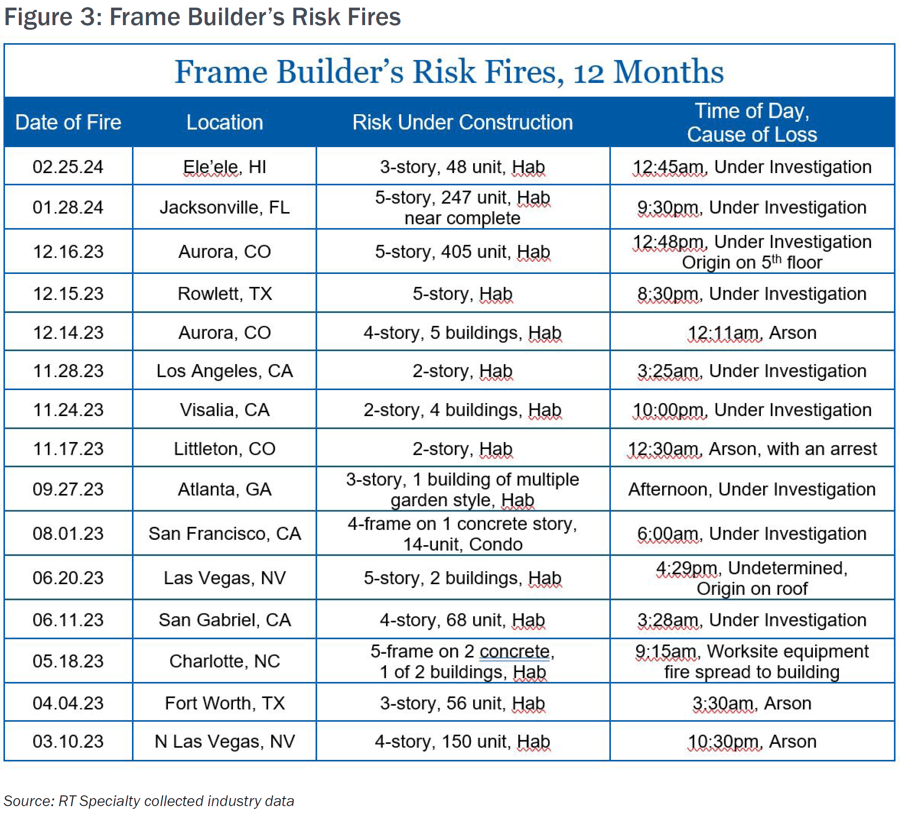
Underwriting results in the multi-family wood frame space remain volatile. This specific segment of the builder’s risk arena saw multiple large fires with origins ranging from arson to general hot works. These topics remain at the forefront of insurer concerns, requiring increased diligence on project security and overall job site risk assessment. See Figure 3.
There is adequate capacity and competition in the multi-family wood frame space to economically place most projects. This trend is most evident in garden-style projects in suburban areas versus large single structure podium construction, which has resulted in some rate stabilization in this segment. The same can also be said for the single-family home builders, yet challenges do arise due to saturation in the high-demand coastal CAT
areas.
The marketplace has shown apprehension with the increase in demand or coverage for renovation projects, with much of the scrutiny coming from the value of the existing structure. The necessity of a current property condition report or, at minimum, an appraisal letter is required by most markets. Expect to see firm pricing and tighter terms and conditions in this space throughout 2024.
Finishing several years with a large number of project ‘starts,’ policy term extensions of current building projects are also a hot topic. Carriers are looking for updated schedules, budgets and compliant loss control measures to offer continued coverage. With inflationary conditions driving costs up, the builder’s risk market is projecting increased pricing and tighter terms and conditions on these extensions of coverage.
Built-to-Rent (BTR) continues to be one of the most active segments of the construction space with developers racing to meet the rental demand for single-family homes and townhomes – both of which have historically been for-sale product – in suburban areas. The exposure presents three unique challenges that require a less traditional program structure:
- Clients often have both course of construction and operational exposure concurrently within the first ninety to one hundred and twenty days of a project.
- Due to the nature of these multi-acre developments, site work often runs six to twelve months before vertical work starts, and most markets carry a three-year max policy term.
- What has become the market normality for site security is usually not feasible.
Finally, and with significant importance, to gain the most competitive advantage and to achieve success, a comprehensive set of data is paramount. Armed with this data and the details regarding the coverages required for a project, RT brokers are poised to yield winning results.
ENERGY
In 2023, the market saw a continued trend of pricing increases for the power and energy market due to losses sustained and the aftermath of Hurricane Ian. Profitability for insurers has been challenged by escalating attritional losses due to inflation, extension of outages due to supply chain constraints and increasing business interruption exposures.
Increased cost of capital and reduced limit on insurers nat-CAT treaties are resulting in a reduction of limits available from some carriers. However, overall capacity has remained relatively stable. Some new entrants into the marketplace are assisting to mitigate cost increases. In addition, insureds are, at times, buying less limit and taking higher deductibles to mitigate premium increases. Coverage and capacity offered by insurers is very much data driven and complete submissions including full engineering information is critical.
WILDFIRE
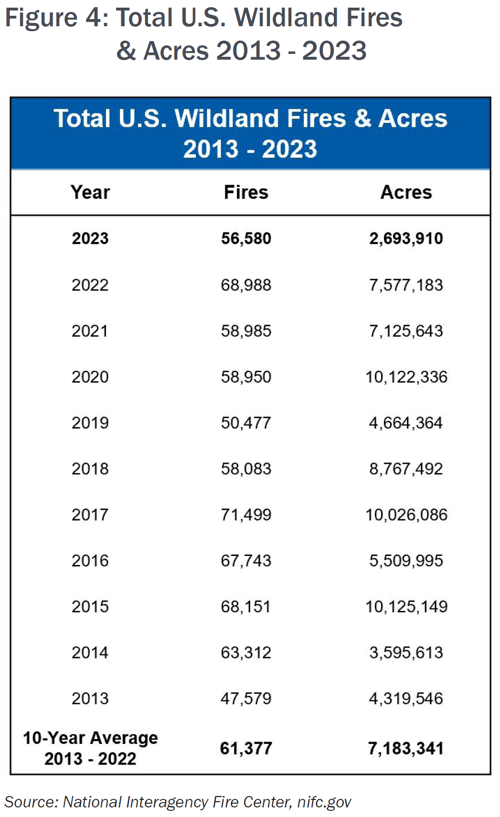
The US saw a reduction in the number of wildfire events in 2023 versus 2022, yet the market for this peril remains extremely challenging due to limited capacity available.
Coverage offered is typically expensive and includes large deductibles. Valuation continues to be a challenging issue. Accurate wildfire hazard mapping is also critical for improvement in underwriting for this sector.
The National Interagency Fire Center’s (NIFC) March 1, 2024 “National Significant Wildland Fire Potential Outlook” through June 2024, cites near normal wildland fire potential for most of the U.S. However, the NIFC reports below normal fire activity in Southern California, and above normal activity in Southeastern Arizona, West Texas and Hawaii. June is typically the start of the western wildfire season, and the NIFC issues updates to this report on the first of each month.
Smokehouse Creek Fire Details
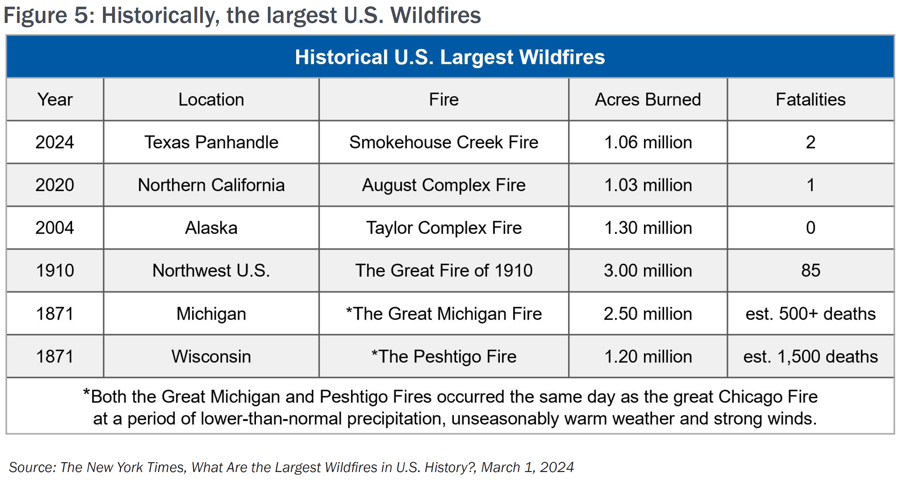
The recent Smokehouse Creek Fire is the largest and most destructive wildfire in Texas history and now ranks second largest in U.S. wildfire history. The fire in Hutchinson County burned over 1.058 million acres, an area larger than the State of Rhode Island and was announced as one hundred percent contained on March 16, 2024.
Igniting on February 26, 2024, near the Oklahoma border, warmer than normal temperatures, dry conditions and strong winds helped spread the fire across the Texas panhandle and into Oklahoma. Later that week, the nearby 687 Reamer Fire merged with the Smokehouse Creek Fire.
According to TheGuardian.com report on March 1, 2024, two people lost their lives and an estimated four to five hundred structures, including over 100 houses, had been destroyed. There was also the loss of an estimated 10,000 cattle, per the Texas Tribune, along with the damage to 1 million acres in the region.
Texas Wildfire History
Previously, the 2006 East Amarillo Complex fire, with twelve deaths and burning over 907,000 acres had been the largest Texas wildfire. The second most destructive Texas fire is the Bastrop County Complex Fire, which killed two people, destroyed 1,673 homes and caused an estimated $325 million in damages in September and October of 2011, according to the Amarillo Globe-News.
Lahaina Wildfire Update
The August 2023 wildfire on the Hawaiian island of Maui ranks fifth in the deadliest U.S. wildfires on record since 1871 with one hundred confirmed victims, reported by WorldVision.org. The site continued to state that total damages are currently estimated at $6 billion, including $1.3 billion in insured losses, and while recovery efforts continue, over 5,400 people remain displaced. According to the Insurance Division of the Hawaii Department of Commerce and Consumer Affairs, close to $1 billion has been paid out to policyholders. However, insurers have recently filed lawsuits against utilities and landowners including Hawaiian Electric, Hawaiian, Telcom and Kamehameha Schools alleging these parties were negligent in allowing the fires to start and spread. See Figures 4 and 5 for U.S. wildfire historical data.
PARAMETRIC
Parametric coverage provides an increasingly compelling alternative to traditional insurance solutions. Due to its speedy claim payouts and transparency of coverage, interest in parametric coverage continues to grow in 2024 as insureds are faced with how to best protect their assets in the evolving property market. Munich Re recently surveyed its LinkedIn followers—out of more than two hundred respondents, 18% said they used parametric insurance to mitigate the effects of extreme weather and natural catastrophes. Buyer understanding and confidence in this product continues to grow with each successful claim payout. The two factors of parametric coverage that make it appealing to buyers are the speedy claim payout process and transparency of coverage. As technology advances and data analytics become more sophisticated, parametric insurance will become more precise.
CATASTROPHE EVENTS 2023
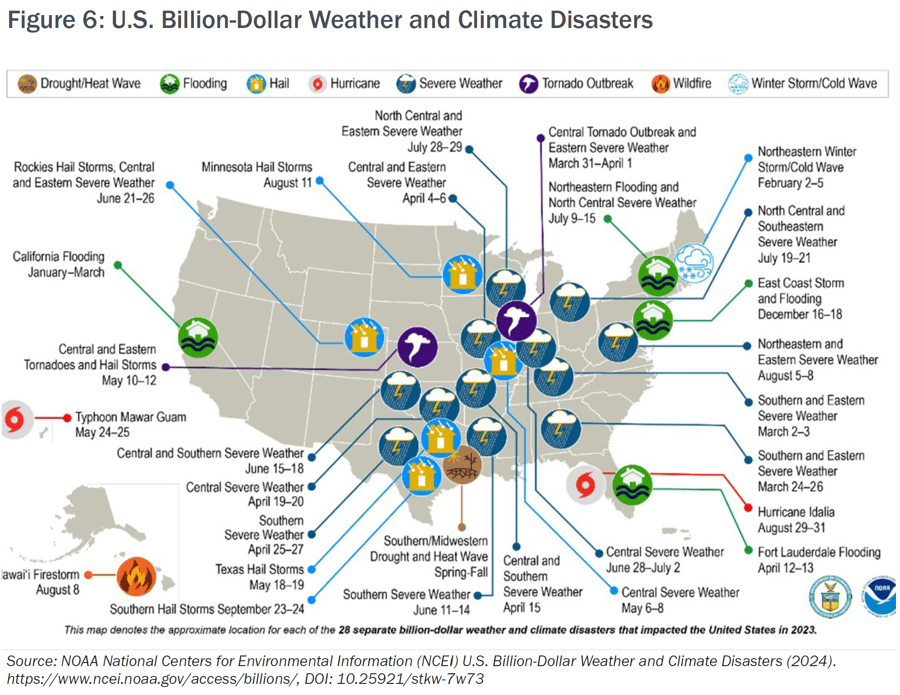
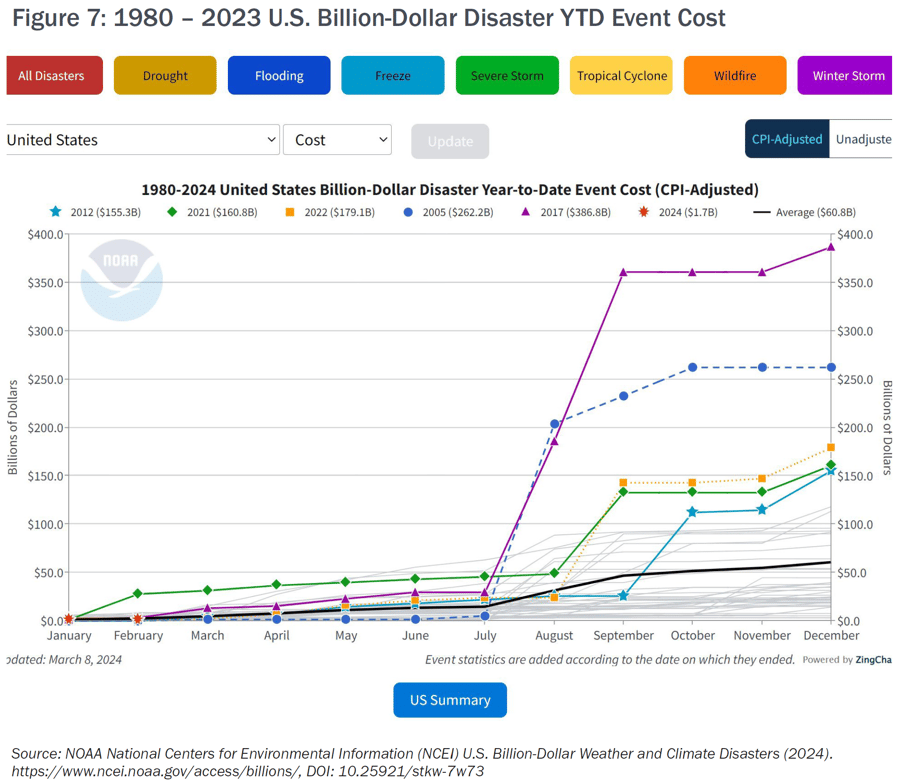
In 2023, there were twenty-eight confirmed weather / climate disaster events with losses exceeding $1 billion each to affect the United States. These events included one drought event, four flooding events, nineteen severe storm events, two tropical cyclone events, one wildfire event, and one winter storm event. Overall, these events resulted in the deaths of 492 people and had significant economic effects on the areas impacted. The 1980–2023 annual average is 8.5 events (CPI-adjusted); the annual average for the most recent five years (2019–2023) is 20.4 events (CPI-adjusted),” per the National Centers for Environmental Information’s webpage “Billion-Dollar Weather and Climate Disasters.” See Figures 6 and 7.
As of mid-March, there has already been one confirmed $1 billion event with Winter Storm Finn affecting many parts of the country.
One event of note which did not make the 2023 listing is Tropical Storm Hilary that occurred in August 2023. This tropical storm was the first California has experienced since 1939, which caused heavy rainfall to parts of both Los Angeles and San Diego metro areas, breaking daily rainfall records for many areas. While economic losses are estimated to be $7 billion to $9 billion, insured losses remained under the $1 billion benchmark due to sparse numbers of flood insurance policies purchased.
HURRICANE OVERVIEW
Early seasonal hurricane forecasts for 2024 indicate increased chances of La Niña by summer. Per the latest ENSO (El Niño-Southern Oscillation) report by NOAA dated March 11, 2024, “A transition from El Niño to ENSO-neutral is likely by April-June 2024 (79% chance), with increasing odds of La Niña developing in June-August 2024 (55% chance).” Combined with already higher than normal sea surface temperatures, meteorologists are warning it could be another active tropical storm season. In 2023, there were twenty named storms with seven hurricanes, of which three became major hurricanes.
On April 4, 2024, CSU (Colorado State University) forecast an “extremely active” season with twenty-four Named Storms including eleven hurricanes and five major hurricanes. CSU will update their forecast on June 11. Other forecasts will include one by TSR (Tropical Storm Risk) on April 8. NOAA will not be issuing their official forecast until May 23 but are warning that if La Nina develops, it could increase the conditions for major hurricanes to form.
The National Hurricane Center (NHC) will be making changes to its cone graphic this year. Currently, NHC only issue watches and warnings for coastal counties, and they will continue with this throughout the tropical storm season. Beginning in August, however, they will issue an additional, experimental graphic adding watches and warnings for interior counties as well which previously were only provided by local National Weather Service offices. Per NHC, the experimental graphic will better help convey the risks inland in addition to the coastal hazards as the current cone only predicts the path of the center of the storm. Because hurricanes can be hundreds of miles wide, the NHC has stated both public officials and private citizens have historically misinterpreted the old graphic.
Below See Figure 8a and 8b for a comparison of the old graphic versus proposed graphic using Hurricane Ian, as an example.
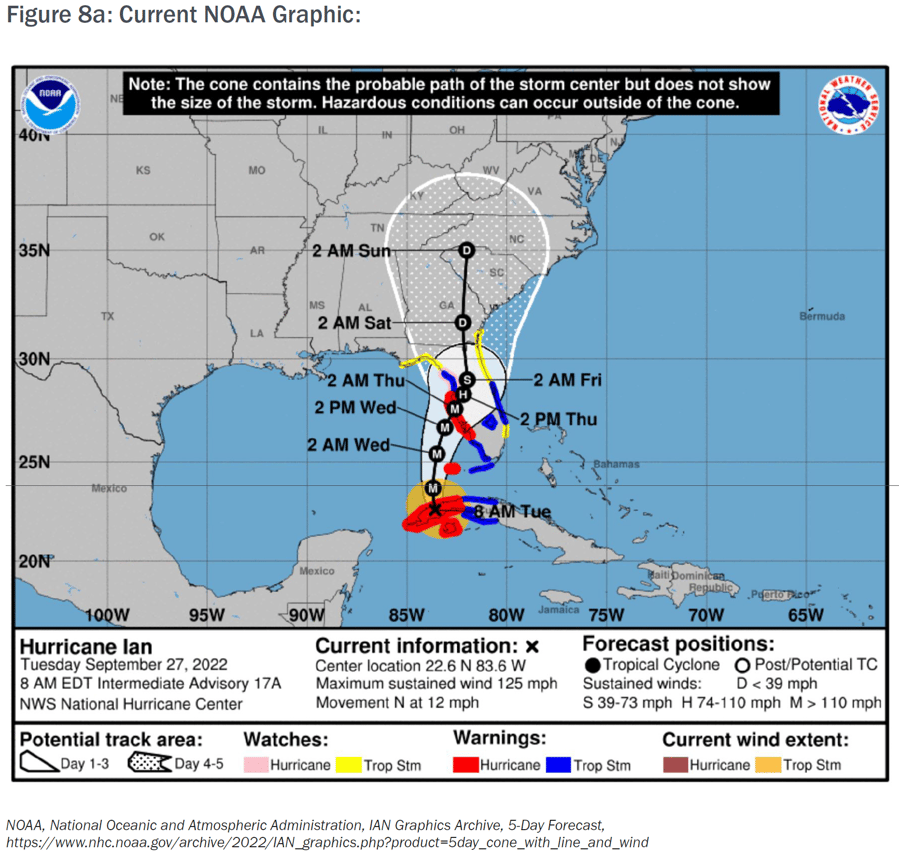
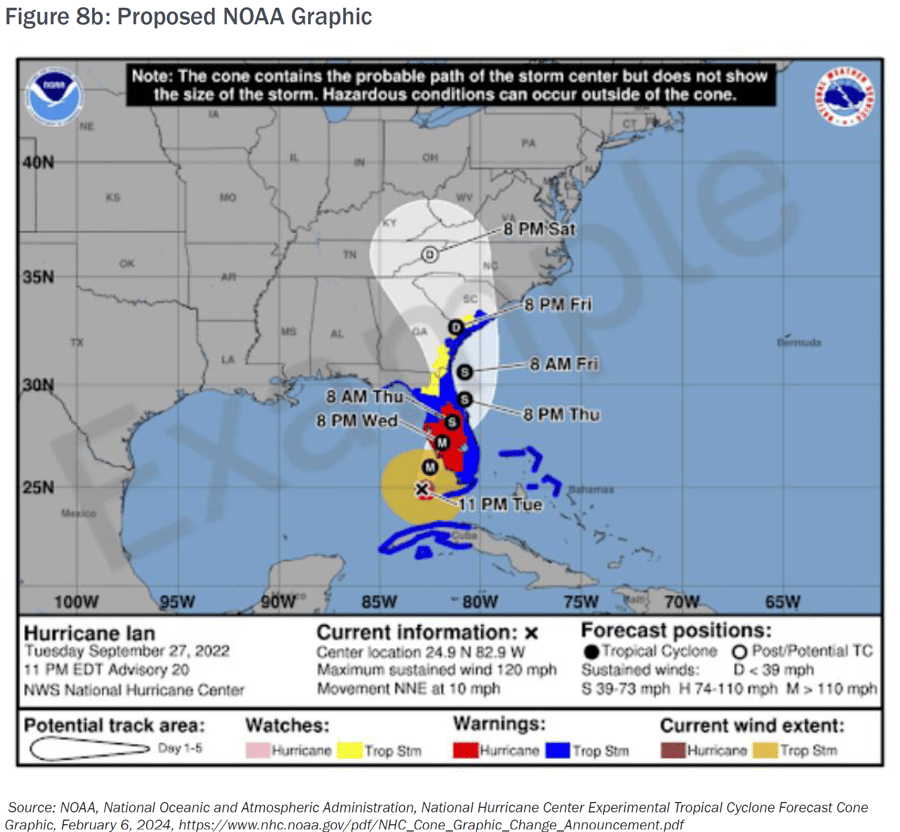
- New experimental cone graphic depicting inland U.S. tropical storm and hurricane watches and warnings will become available in 2024.
- Will help convey wind hazard risk
- Graphic may not be available as soon as the current cone graphic, due to the time needed to compile complete inland watch and warning information
- Will be available beginning on or around August 15, 2024
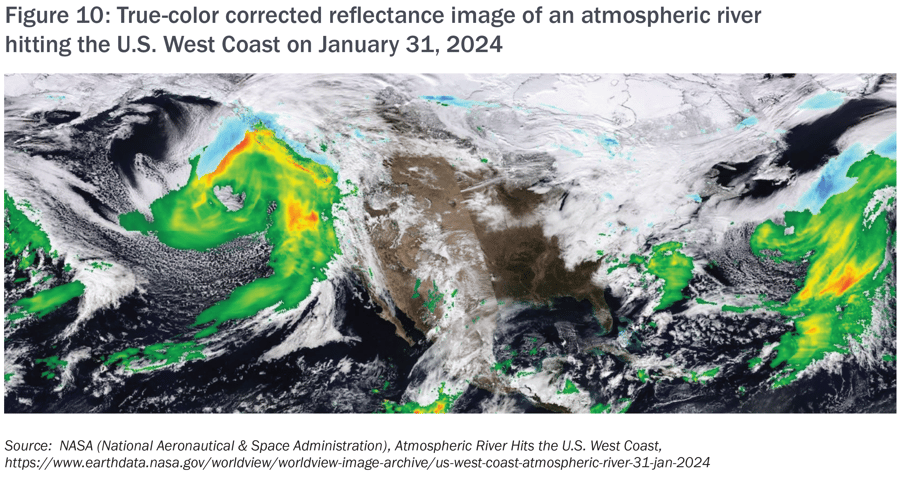
ATMOSPHERIC RIVERS
While the term “atmospheric river” was only coined three decades ago, scientists and meteorologists are racing to further understand this weather phenomenon that has been recorded back to the 1800s with the Great Storm / Flood of 1861-1862 and why these atmospheric rivers are seemingly increasing in frequency and destructiveness. Since December 2022, dozens of atmospheric rivers have brought record breaking rainfall and flooding to California and the Pacific Northwest. While the economic losses are in the billions, a relatively small number of damages are insured, as less than two percent of households purchase flood insurance. See Figure 9 for the science behind atmospheric rivers, per the NOAA (National Oceanic and Atmospheric Administration).

Per the recent National Interagency Fire Center (NIFC) outlook report, “Several atmospheric rivers made landfall on the West Coast, with the greatest impacts in California. The strongest series of atmospheric rivers hit California February 3-6, with downtown Los Angeles receiving over eight inches of rain in a seventy-two-hour period. Over a foot of liquid equivalent precipitation fell in portions of the southern California mountains, much of which fell as snow above 6,000 feet.”
SUMMARY
RT Specialty is well positioned to assist all our key retail trading partners to navigate the ever-changing landscape of commercial property insurance.
Contact your RT Specialty broker or underwriter today.
THE RT SPECIALTY PROPERTY COMMITMENT
“The excess and surplus lines (E&S) market continues to grow each year and adapts quickly as the market changes. RT Specialty monitors these changes and utilizes our key resources, talent, and technology to capitalize on competitive solutions for our retail trading partners and their clients. Focusing on creativity, customization, and innovation, our commitment to excellence demands we remain diligent in navigating current challenges as well as those in the future,” says Brenda (Ballard) Austenfeld, CEO & President of RT Specialty’s National Property Practice.
RT Property is a part of RT Specialty. RT Specialty is a division of RSG Specialty, LLC, a Delaware limited liability company based in Illinois. RSG Specialty, LLC, is a subsidiary of Ryan Specialty, LLC. RT Specialty provides wholesale insurance brokerage and other services to agents and brokers. As a wholesale broker, RT Specialty does not solicit insurance from the public. Some products may only be available in certain states, and some products may only be available from surplus lines insurers. In California: RSG Specialty Insurance Services, LLC (License #0G97516) ©2024 Ryan Specialty, LLC
This Article is provided for general information purposes only and represents RT Specialty’s opinion and observations on the current outlook of the US Property Insurance market and does not constitute professional advice. No warranties, promises, and/or representations of any kind, express or implied, are given as to the accuracy, completeness, or timeliness of the information provided in this Article. No user should act on the basis of any material contained herein without obtaining professional advice specific to their situation.